03
Dec
2020

Spreads were mostly unchanged across most securitized products sectors through October. Participation across dealers and investors was generally healthy as we head into year end. This month, as we head into the slowest part of the year with the holidays approaching, we would like to discuss some key points that have served as tailwinds for the market.
The Election results, which are now confirmed, have provided some calm to the markets. Though Georgia’s Senate races and thus the Senate are still pending, the Presidential election results seem to be behind us. That, combined with positive COVID-19 vaccine news, has fueled the best month in the stock market since 1988.
10-year treasury rates started October at approximately 70 basis points (“bps”) and peaked just a hair shy of 1% which was a welcome occurrence. Much of the fixed income market has continued to struggle with the proverbial “hunt for yield”. Although risk-free rates have a ways to go before reaching what we would consider attractive levels, we are cautiously optimistic they are moving in the right direction. Rising long-term rates, along with a steepening yield curve, portend to healthier fixed income markets.
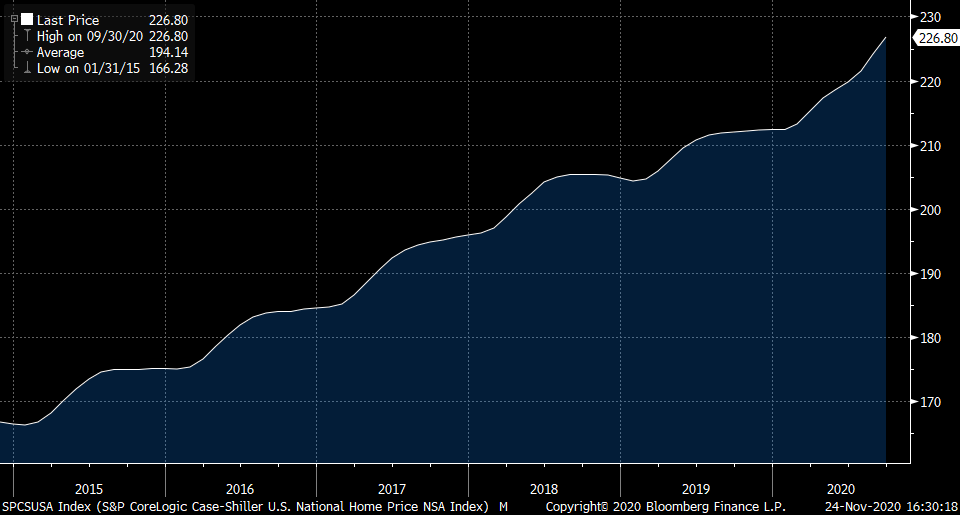
Housing fundamentals are as strong as ever. Almost 100% of our exposure is to single family, residential housing. We are pleased that this asset class has by far been one of the biggest winners of 2020. In a world where we’re entering our ninth month of lockdown, with possibly many more to go, homes have been the most coveted asset class for individuals. Between record low interest rates and massive demand relative to supply for single family homes, home price appreciation has hit record levels this year. What does this mean for our bond portfolio? The net effect can be summed up by one word: safer. That’s easy to say but why is this the case?
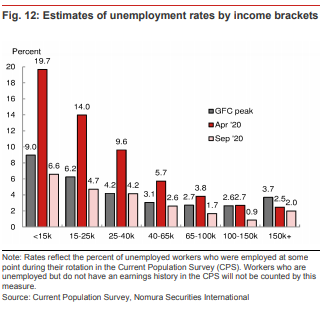
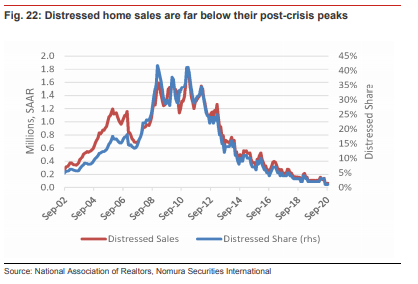
Data reflecting the current state of housing and unemployment are shown in the Appendix below.
While the market seems sanguine, there continue to be indiscriminate sellers providing us with ample opportunities to purchase attractive bonds. These are folks that are throwing in the towel for one reason or another. On the flip side, with the $6tr the Fed has pumped into the economy, there are also indiscriminate buyers.
We continue to shed assets where we feel the upside has been realized and acquire bonds that either hold asymmetric upside or strong cash on cash returns with low downside.
Housing activity is robust. 30-Year mortgage rates hit a new record low once again, falling to 2.72%. Home prices and new home sales are at or near a 10-year high. Agency mortgages continue to offer better spreads versus treasuries with similar duration. Agency mortgages currently offer +98 bps of additional yield versus the US 5-year treasury bond.
Non-Agency RMBS
|
Non-Agency Credit Spreads |
|||||
|
Benchmark |
Sector |
10/23/2020 |
10/30/2020 |
11/6/2020 |
11/13/2020 |
|
DM (1month LIBOR) |
CRT BBB |
129 |
110 |
166 |
130 |
|
DM (1month LIBOR) |
CRT BB/B |
311 |
454 |
453 |
484 |
|
OAS |
Prime JUMBO |
117 |
132 |
110 |
100 |
|
Swaps |
NQM AAA |
90 |
100 |
95 |
95 |
|
Swaps |
RPL AAA |
93 |
95 |
95 |
95 |
|
Swaps |
RPL BBB |
265 |
240 |
240 |
240 |
|
DM (1month LIBOR) |
SFR AAA |
85 |
88 |
87 |
86 |
|
DM (1month LIBOR) |
LEGACY RMBS |
291 |
292 |
297 |
294 |
Source: JP Morgan, Nomura
|
New Issue Activity ($billions, as of November 23, 2020) |
|||||
|
Sector |
2018 |
2019 |
2020– YTD |
2020 Projected |
2021 Projected |
|
CRT |
17.8 |
19.93 |
16.70 |
17.00 |
37 to 47 |
|
Prime 2.0 |
17.36 |
17.49 |
15.00 |
17.00 |
24.00 |
|
NPL/RPL/Seasoned |
47.64 |
38.84 |
27.00 |
30.00 |
45.00 |
|
SFR |
6.86 |
3.89 |
8.90 |
9.00 |
5.00 |
|
Non-QM |
11.35 |
25.24 |
17.00 |
18.00 |
32.00 |
Source: JP Morgan, Nomura
Agency RMBS
US New Home Sales: Strong, near 10-year high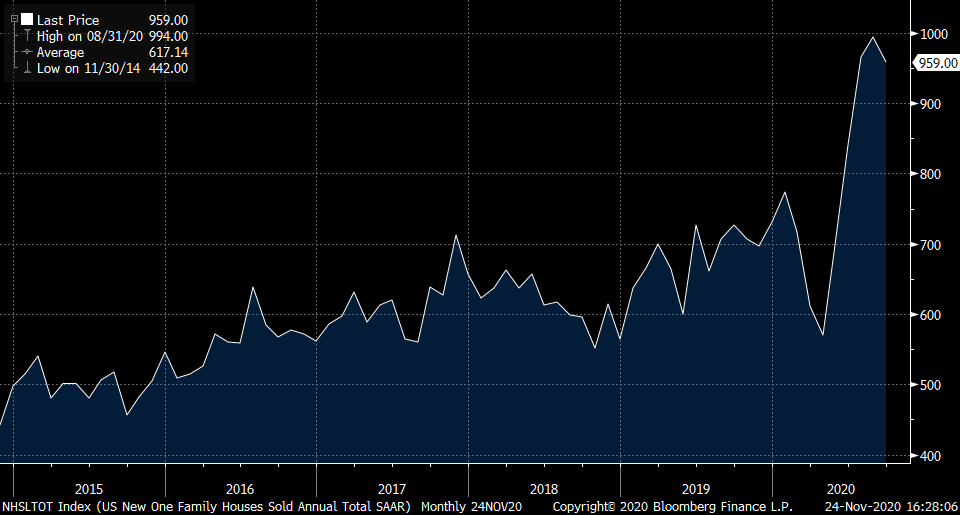
US Home Price Index: Home prices keep going up